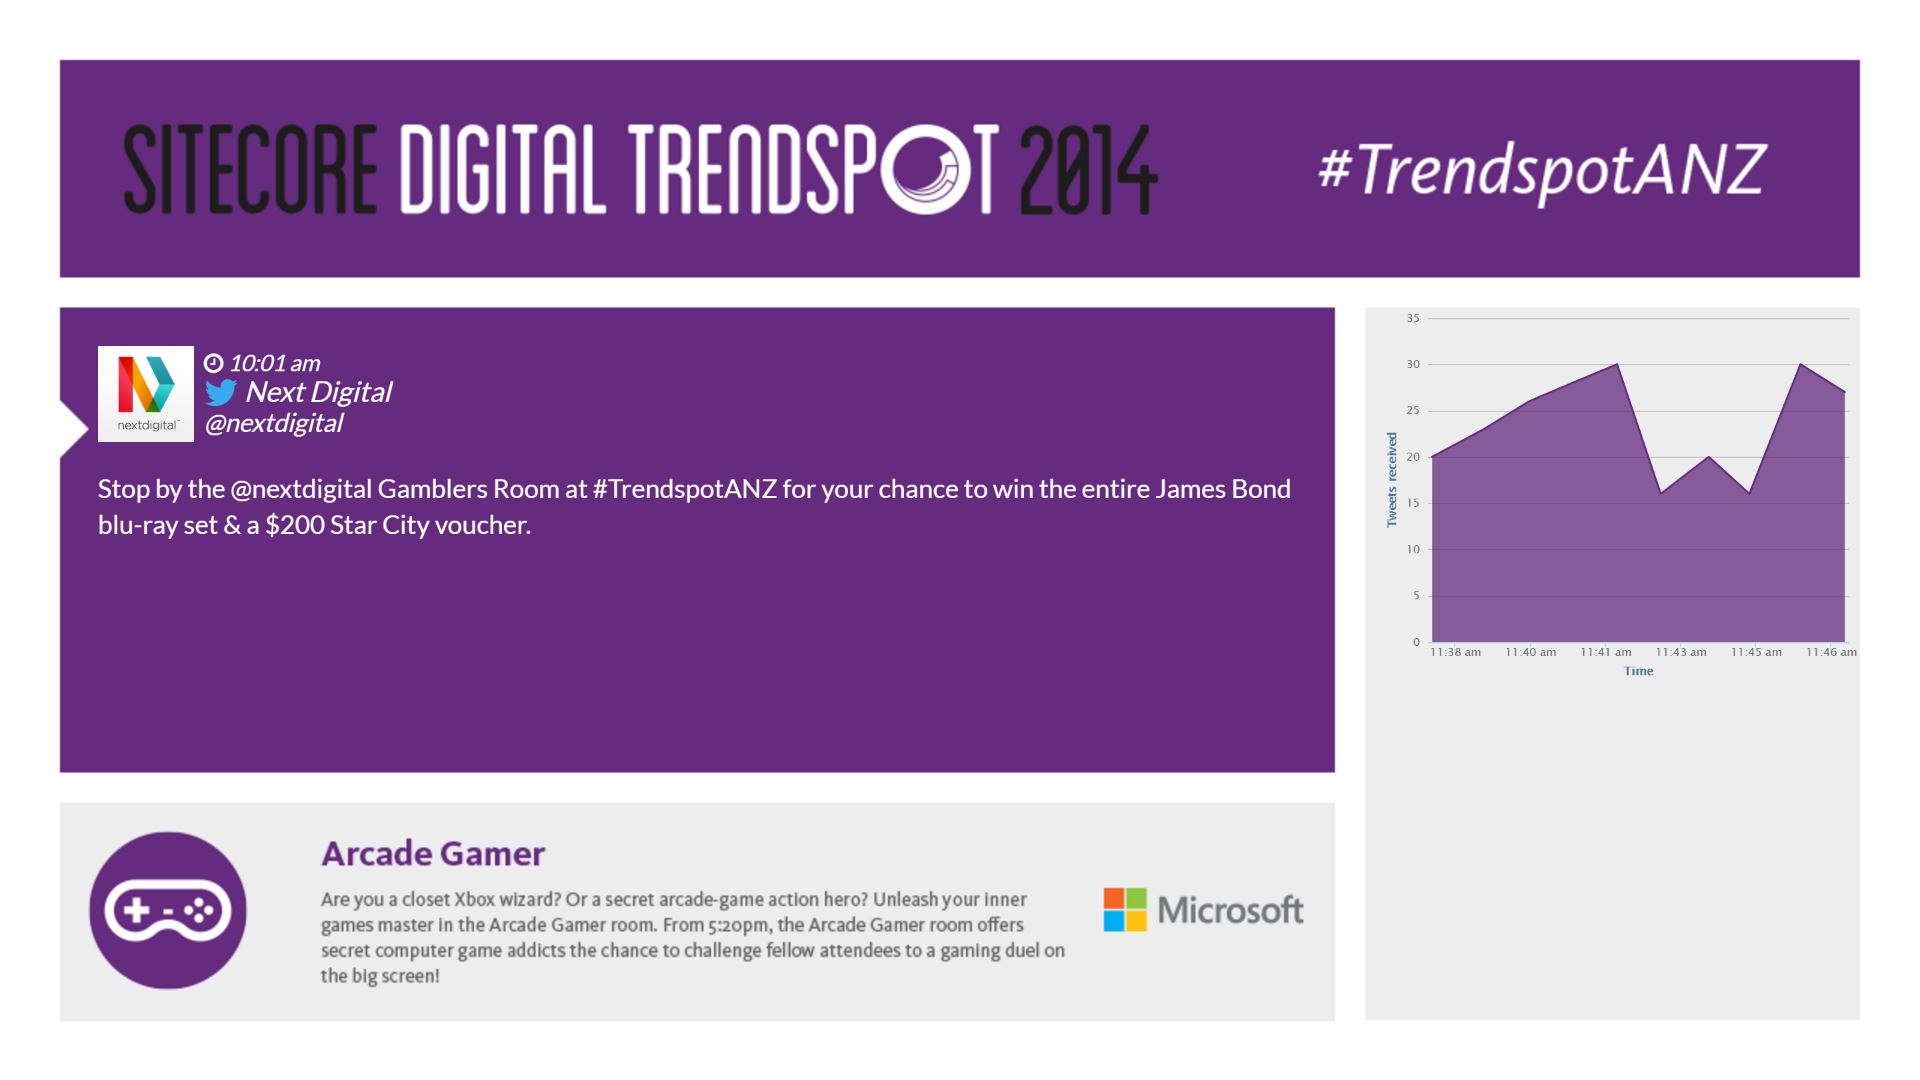
We use cookies to ensure that we give you the best experience on our website. If you continue without changing your settings, we'll assume that you are happy to recieve all cookies on the SocialWall Pro website. However, if you would like to, you can change your cookie settings at any time.

Find out more Continue

Visualize live Twitter peaks and troughs with a Tweet Graph

Live Tweet Graph

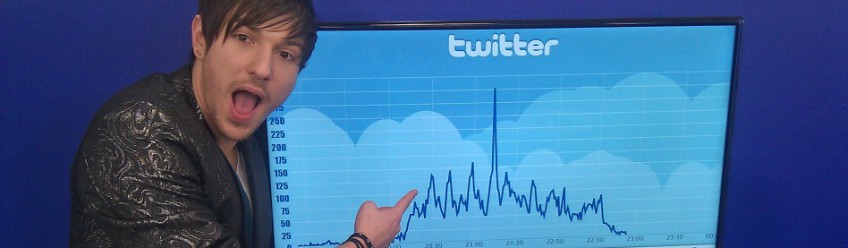
Visualize the peaks and troughs of Twitter conversation along your live events with our Tweet Graph.

As key moments unfold Twitter statistics are illustrated, driving more social engagement as onlookers join in the fun!

Great for Live TV Shows and sporting events, this real time Tweet Graph generates fan engagement and connects your social community around the globe.


Tweet graph integrated on a social wall for Sitecore Digital Trendspot event


Case Usage: Voice Belgique

Used alongside the Voice Belgique singer and DJ Quentin Mosimann, member of judging panel, challenged his followers to Tweet when they heard the song “Alors on danse” during the show. The result? It sparked a major flurry on Twitter, leading to trending status on the social platform.

Case Usage: SiteCore

To visually demonstrate social volume at the SiteCore Digital Conference, a TweetGraph was integrated into the wall.  Dynamically changing throughout the conference, participants could visually see the peaks in conversation. 

Creative spark

Let our creative team work their magic with a complete custom display integrating your brand or event theme. Have a champagne bottle bubbling on screen and when conversation peaks have the cork pop out and let the champagne flow…